Comparing ResMem and MemNet
In my previous posts about Memorability (see the project link above), I’ve been talking about the performance of my models fairly matter-of-factly. I’ve been comparing their scores on things, reporting them in abstracts, and talking about how one model performs better than another, and why I think that is happening. Some questions arise though, for example, why did I get such a vastly different score with MemNet than what Khosla et al. reported in their original paper? Why is it possible, as has occurred in some cases, for rank correlation to improve while loss worsens? If a given model is better than another, shouldn’t both measures improve? Why are we using rank correlation to measure the effectiveness of the model in the first place, if they’re being trained on MSE Loss?
Memorability and “Performance”
Memorability is a tricky thing. It fits somewhere between vision and memory. While it’s fundamentally intertwined with human behavior, ability, and cognition, it’s been shown to be an intrinsic attribute of an image. Memorability is measured as a score from 0 to 1, that describes roughly the probability that someone will correctly recall the image in laboratory conditions. The problem is, the number changes depending on those laboratory conditions. In the memorability test that has become the standard (Isola et al. 2014) a image may receive a score of 0.79. A test that is designed differently would yield a different absolute score, for example, a test that flashes the images for a shorter period of time. We can also imagine a test that skews the results in the other direction. Thus, we need to consider what this score actually is.
We have two claims to reconcile, that the score can be manipulated by other experimental conditions, but it is also innate to the image. This tells us that the memorability score must be ordinal, and not cardinal. In other words, if we have a set of ten images, with memorability scores derived from the standard memorability test, and we run these images through another experiment, while we may get different numbers, they will be in roughly the same order. This makes regressing upon memorability a difficult task. If the absolute number isn’t universally consistent, then how do we model it?
We also have an opposing problem; the notion of “Performance” in deep learning is not straightforward either. Any paper you read on a new deep learning architecture will report a series of numbers at you. The standard ones are MSE Loss, Categorical Cross-Entropy, Maximum Likelihood, and the like. For more complex tasks we might see GLUE (Wang et al. 2018), SuperGLUE (Wang et al. 2020) scores in the natural language space. We might see things like Average Log-Likelihood or the Inception Score for GANs. In a paper you see one score reported. That score is often an average of a number of runs of the best model that the researchers made, over the course of a year. ResMem took me somewhere on the order of 400 experiments over the course of four months. A standard deep learning model takes ~3000 experiments to perfect (Karras et al. 2020). With every experiment, there is some sort of evaluation stage, and the best thing for a researcher to do is to have that stage spit out a number (or a set of numbers) that describe performance. Of course, those performance figures have uncertainty attached to them too, leading us into an epistemic quagmire. On top of that, you need to choose one performance metric to be the loss function, the thing that is being optimized. The loss function must also be differentiable, which many of these metrics are not. It helps if the loss function can take a single $x,y$ pair as an input, but it isn’t required.
So, for measuring performance on the memorability task, we are dealing with two concepts that are both amorphous. This poses a challenge. Memorability estimations in the past have used Spearman rank correlation as their measure of goodness-of-fit. This arises from the fact that Spearman rank correlation is used as a measure of consistency within a dataset. In this context, the number refers to the rank correlation between the memorability scores generated by two subset of the test population. In the context of a deep learning model, the number refers to the rank correlation between the scores generated by human subject trials and the scores generated by the model. In general it is thought that if a model’s predictions have higher rank correlation with the data than the data has within itself, then the model has succeeded, and any further increases in rank correlation do not increase predictive power. I will argue that this is not necessarily true.
The neural network is just doing a regression. It’s a very fancy regression, but a regression nonetheless. For each image, we give it a number. Over a long training period, it tries to figure out what parts of an image correspond with what numbers, and it does a pretty good job. We test it on a set of images that it has not seen, and it performs well enough on them. When we’re describing what the model is doing, however, we need to understand this more deeply. The neural network has no background knowledge. It’s not making educated guesses. It’s making guesses based on the statistical nature of the training set. The real innovation that a neural network has over other forms of regression is that it can find higher level features in its inputs, and tune what those features are on its own. Every regression is a game of averages. When the neural network is given a new image that it has not seen before, it considers the presence and absence of features it has seen before, and returns the expected value of an image with those features. If you fed a neural network two images that are identical, but with different values, it would predict the midpoint for that image.[^1]
Considering that the neural network is only predicting the value of it’s provided $y$-values, then we must realize that the neural network does not predict whether or not a human will remember the image. It predicts the proportion of successes on the memory test. Then, when we measure the rank correlation of a model’s predictions with the ground truth values, we are measuring how consistent the rankings are with human rankings. The inter-human rank correlation for LaMem is reported as 0.67 (Khosla et al 2015). For MemCat it is 0.78 (Goetschalckx et al. 2019). These scores are used as a measure of data quality, and increasing the number of humans in the study will increase the inter-human rank correlation.
Given all of this, what then does it mean if a model gets a higher rank correlation with the ground truth than the inter-human rank correlation on the same data? Well, the model is predicting the expected value of an image’s memorability, and the expected value is calculated from the average score in human trials. Thus, a very good model is predicting that average score with high accuracy. The rank correlation, then, measures how well the model predicts the whole group of human subjects’ average memorability. The inter-human rank correlation measures how well a subset of the human subjects predicts the other subsets’ average memorability. You cannot consider the inter-human subjects rank correlation to be a “skill ceiling” because they are measuring different things.
So, as this discussion goes into the performance of these models on different datasets, consider all of these caveats. Performance and accuracy is not necessarily straightforward. Two numbers are not necessarily comparable even if they’re generated the same way. For example, a model’s rank correlation on one dataset is not comparable to the model’s rank correlation on another. Since the ground truth values attached to each image are averages, they need to be treated as estimates of the true memorability as well, and the error associated with those scores is not consistent within a dataset or across datasets.
High Level Features
Each layer of a Convolutional Neural Network or Residual Neural Network does feature extraction. They extract features in the output of the previous layer, and the first layer extracts features from the input image. The thing is, these “features” resist definition. They are, ultimately, patterns that appear in the data, and when optimized, the model picks out the patterns that are most useful in solving the problem. Because these features resist definition, it’s difficult to tell what the model is latching on to. They can only be analyzed post facto.
Because of this ambiguity, it can be hard to tell why a deep learning model is estimating one image as memorable and another as not memorable. There are some analyses we can do, but exactly identifying what these features are is difficult and often subjective. Even when using techniques like feature optimization, we can end up with images that look like this:
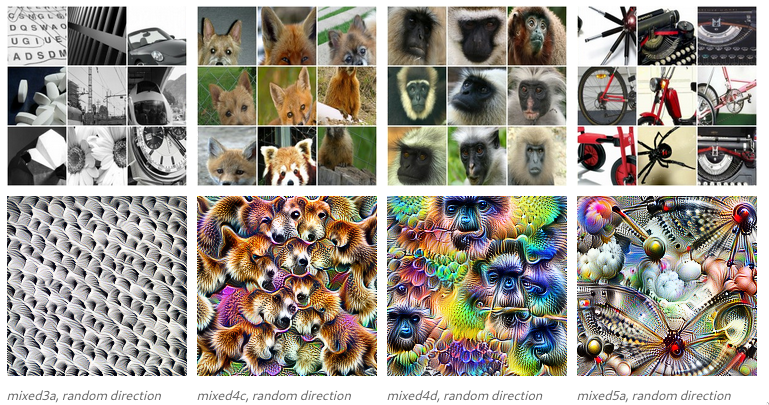
These images are created by making an image that optimally triggers a particular feature in our model. For the earlier layer, 3, we see a pattern. The scaly, oblate shape. Flower petals, the ends of medicine caplets, the headlights on a car. The later layers (the other three examples) show more complex features. The connected wheels of a bicycle, the primatoid facial features, and the caniform features of some animals. (Olah et al. 2017)
The consensus is that early layers, the patterns, are more perceptual and the later layers are more conceptual (Jozwik et al. 2018). Using more examples, we can see this progression visually.
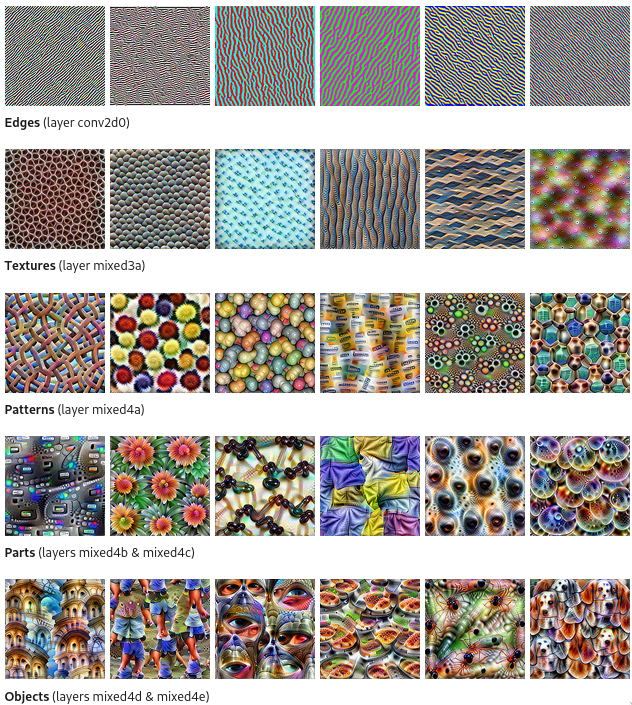
These images are created by optimizing the inputs to maximally trigger a certain feature in the model. We also have an opposing problem; the notion of “Performance” in deep learning is not straightforward either. Any paper you read on a new deep learning architecture will report a series of numbers at you. The standard ones are MSE Loss, Categorical Cross-Entropy, Maximum Likelihood, and the like. For more complex tasks we might see GLUE (Wang et al. 2018), SuperGLUE (Wang et al. 2020) scores in the natural language space. We might see things like Average Log-Likelihood or the Inception Score for GANs. In a paper you see one score reported. That score is often an average of a number of runs of the best model that the researchers made, over the course of a year. ResMem took me somewhere on the order of 400 experiments over the course of four months. A standard deep learning model takes ~3000 experiments to perfect (Karras et al. 2020). With every experiment, there is some sort of evaluation stage, and the best thing for a researcher to do is to have that stage spit out a number (or a set of numbers) that describe performance. Of course, those performance figures have uncertainty attached to them too, leading us into an epistemic quagmire. On top of that, you need to choose one performance metric to be the loss function, the thing that is being optimized. The loss function must also be differentiable, which many of these metrics are not. It helps if the loss function can take a single $x,y$ pair as an input, but it isn’t required.
So, for measuring performance on the memorability task, we are dealing with two concepts that are both amorphous. This poses a challenge. Memorability estimations in the past have used Spearman rank correlation as their measure of goodness-of-fit. This arises from the fact that Spearman rank correlation is used as a measure of consistency within a dataset. In this context, the number refers to the rank correlation between the memorability scores generated by two subset of the test population. In the context of a deep learning model, the number refers to the rank correlation between the scores generated by human subject trials and the scores generated by the model. In general it is thought that if a model’s predictions have higher rank correlation with the data than the data has within itself, then the model has succeeded, and any further increases in rank correlation do not increase predictive power. I will argue that this is not necessarily true.
The neural network is just doing a regression. It’s a very fancy regression, but a regression nonetheless. For each image, we give it a number. Over a long training period, it tries to figure out what parts of an image correspond with what numbers, and it does a pretty good job. We test it on a set of images that it has not seen, and it performs well enough on them. When we’re describing what the model is doing, however, we need to understand this more deeply. The neural network has no background knowledge. It’s not making educated guesses. It’s making guesses based on the statistical nature of the training set. The real innovation that a neural network has over other forms of regression is that it can find higher level features in its inputs, and tune what those features are on its own. Every regression is a game of averages. When the neural network is given a new image that it has not seen before, it considers the presence and absence of features it has seen before, and returns the expected value of an image with those features. If you fed a neural network two images that are identical, but with different values, it would predict the midpoint for that image.[^1]
Considering that the neural network is only predicting the value of it’s provided $y$-values, then we must realize that the neural network does not predict whether or not a human will remember the image. It predicts the proportion of successes on the memory test. Then, when we measure the rank correlation of a model’s predictions with the ground truth values, we are measuring how consistent the rankings are with human rankings. The inter-human rank correlation for LaMem is reported as 0.67 (Khosla et al 2015). For MemCat it is 0.78 (Goetschalckx et al. 2019). These scores are used as a measure of data quality, and increasing the number of humans in the study will increase the inter-human rank correlation.
Given all of this, what then does it mean if a model gets a higher rank correlation with the ground truth than the inter-human rank correlation on the same data? Well, the model is predicting the expected value of an image’s memorability, and the expected value is calculated from the average score in human trials. Thus, a very good model is predicting that average score with high accuracy. The rank correlation, then, measures how well the model predicts the whole group of human subjects’ average memorability. The inter-human rank correlation measures how well a subset of the human subjects predicts the other subsets’ average memorability. You cannot consider the inter-human subjects rank correlation to be a “skill ceiling” because they are measuring different things.
So, as this discussion goes into the performance of these models on different datasets, consider all of these caveats. Performance and accuracy is not necessarily straightforward. Two numbers are not necessarily comparable even if they’re generated the same way. For example, a model’s rank correlation on one dataset is not comparable to the model’s rank correlation on another. Since the ground truth values attached to each image are averages, they need to be treated as estimates of the true memorability as well, and the error associated with those scores is not consistent within a dataset or across datasets.
High Level Features
My version of MemNet, as well as most of my models, were trained on a mixture of LaMem and MemCat (Goetschalckx et al. 2019). MemCat is a smaller, but higher quality dataset of images and memorabilities. It has 10,000 images, and its inter-human rank correlation is 0.78, for comparison. This value generally increases with the amount of samples the dataset has per image, and it scales with the certainty of each value. MemCat was designed to help understand how memorability changes across categories of images.
Generally, these two datasets are great for this task. That being said, it’s worth considering why they were compiled, and how that could effect our deep learning models. LaMem was compiled from a group of other datasets, which in turn were compiled to study some conceptual aspect of images. Considering the data sources for LaMem, we can notice that they aren’t exactly a general sampling of human imagery. Flickr, for example, generally has weird images, things that people wanted to show off for some reason. Among the other data sources, we have images that are designed to trigger eye movement, images that are designed to be anomalous, images that are designed to be affective, and so on. Even without knowing which images are from where, if you scroll through LaMem, you get the sense that the images are sort of strange. They may have some high level conceptual features that could mean that LaMem is not very generalizable in that sense. On the other side of things, LaMem is very generalizable across image types. LaMem contains images of scenes, images of objects, images of people, and even a few images of text and iconography. The vast majority of LaMem’s images are scenes, but the fact that it contains images of other types will improve the generalizability of the model across those types.
MemCat, on the other hand, was designed to describe a bunch of categories of things. This leads to technical problems in its own right. Each image has to fit neatly into a category, and as such, every image is an object type image. However, what MemCat sacrifices in type-generalizability, it earns back in within-object generalizability. There are roughly a hundred images of deciduous forests and a hundred more of coniferous forests. There are 61 images just of martens (although I think one is a weasel and one more is a stoat).
Now, when you mix these two datasets together, then you end up with a larger dataset, with a mixture of objects, scenes, and miscellaneous images. The trends and features found in the larger, but lower certainty dataset get reinforced by the smaller, more precise dataset, and ideally, you end up with a model that is powerful and generalizable on multiple axes.
Performance of MemNet
Given all of these caveats about performance and memorability, let’s talk about MemNet’s performance. We have two separate versions of MemNet that we’re considering. There’s one which was reverse engineered and trained on a combination dataset, and one that was downloaded directly from Khosla’s website.
Preliminary investigations found here indicate that the version of MemNet found online may have had some technical issues. In short, the model is probably overfit. The distribution of predictions when run on LaMem is much tighter than the distribution of LaMem’s ground truths. This indicates some degree of regression towards the mean.
By reconstructing MemNet in PyTorch by reverse engineering the model found online, we can learn more about the training process. By training this new model on both MemCat and LaMem, we can consider hypothetical alternate versions of the model.
An older analysis of this can be found here.
One of the things to note here is that while the reverse engineered MemNet can achieve rank correlations as reported, it takes some time for it to get there when trained on LaMem alone. When that model is then tested on MemCat, it scores much worse than it does on a validation set from LaMem. Even more interesting is the fact that when the model from the website is tested on MemCat, it achieves a rank correlation of 0.22. This indicates two things. First, the original MemNet model was, while probably not overfit on LaMem, overfit overall. It takes a relatively long time for the model to train on LaMem alone until it reaches a rank correlation similar to that reported in the paper, and once it gets there its rank correlation on MemCat falls sharply. This is possibly due to the fact that LaMem’s images have a lot of strange high-level features. The second thing is that when MemNet is trained on MemCat, it performs exceedingly well on LaMem. This indicates that whatever features are learned when training on MemCat are more effective at predicting memorability on LaMem than the other way around.
The reverse engineered MemNet has a pretty good distribution of predictions, better than the caffe model. However, it still holds too much probability mass around the mean, and has a hard cutoff on the high end. This is shown below.
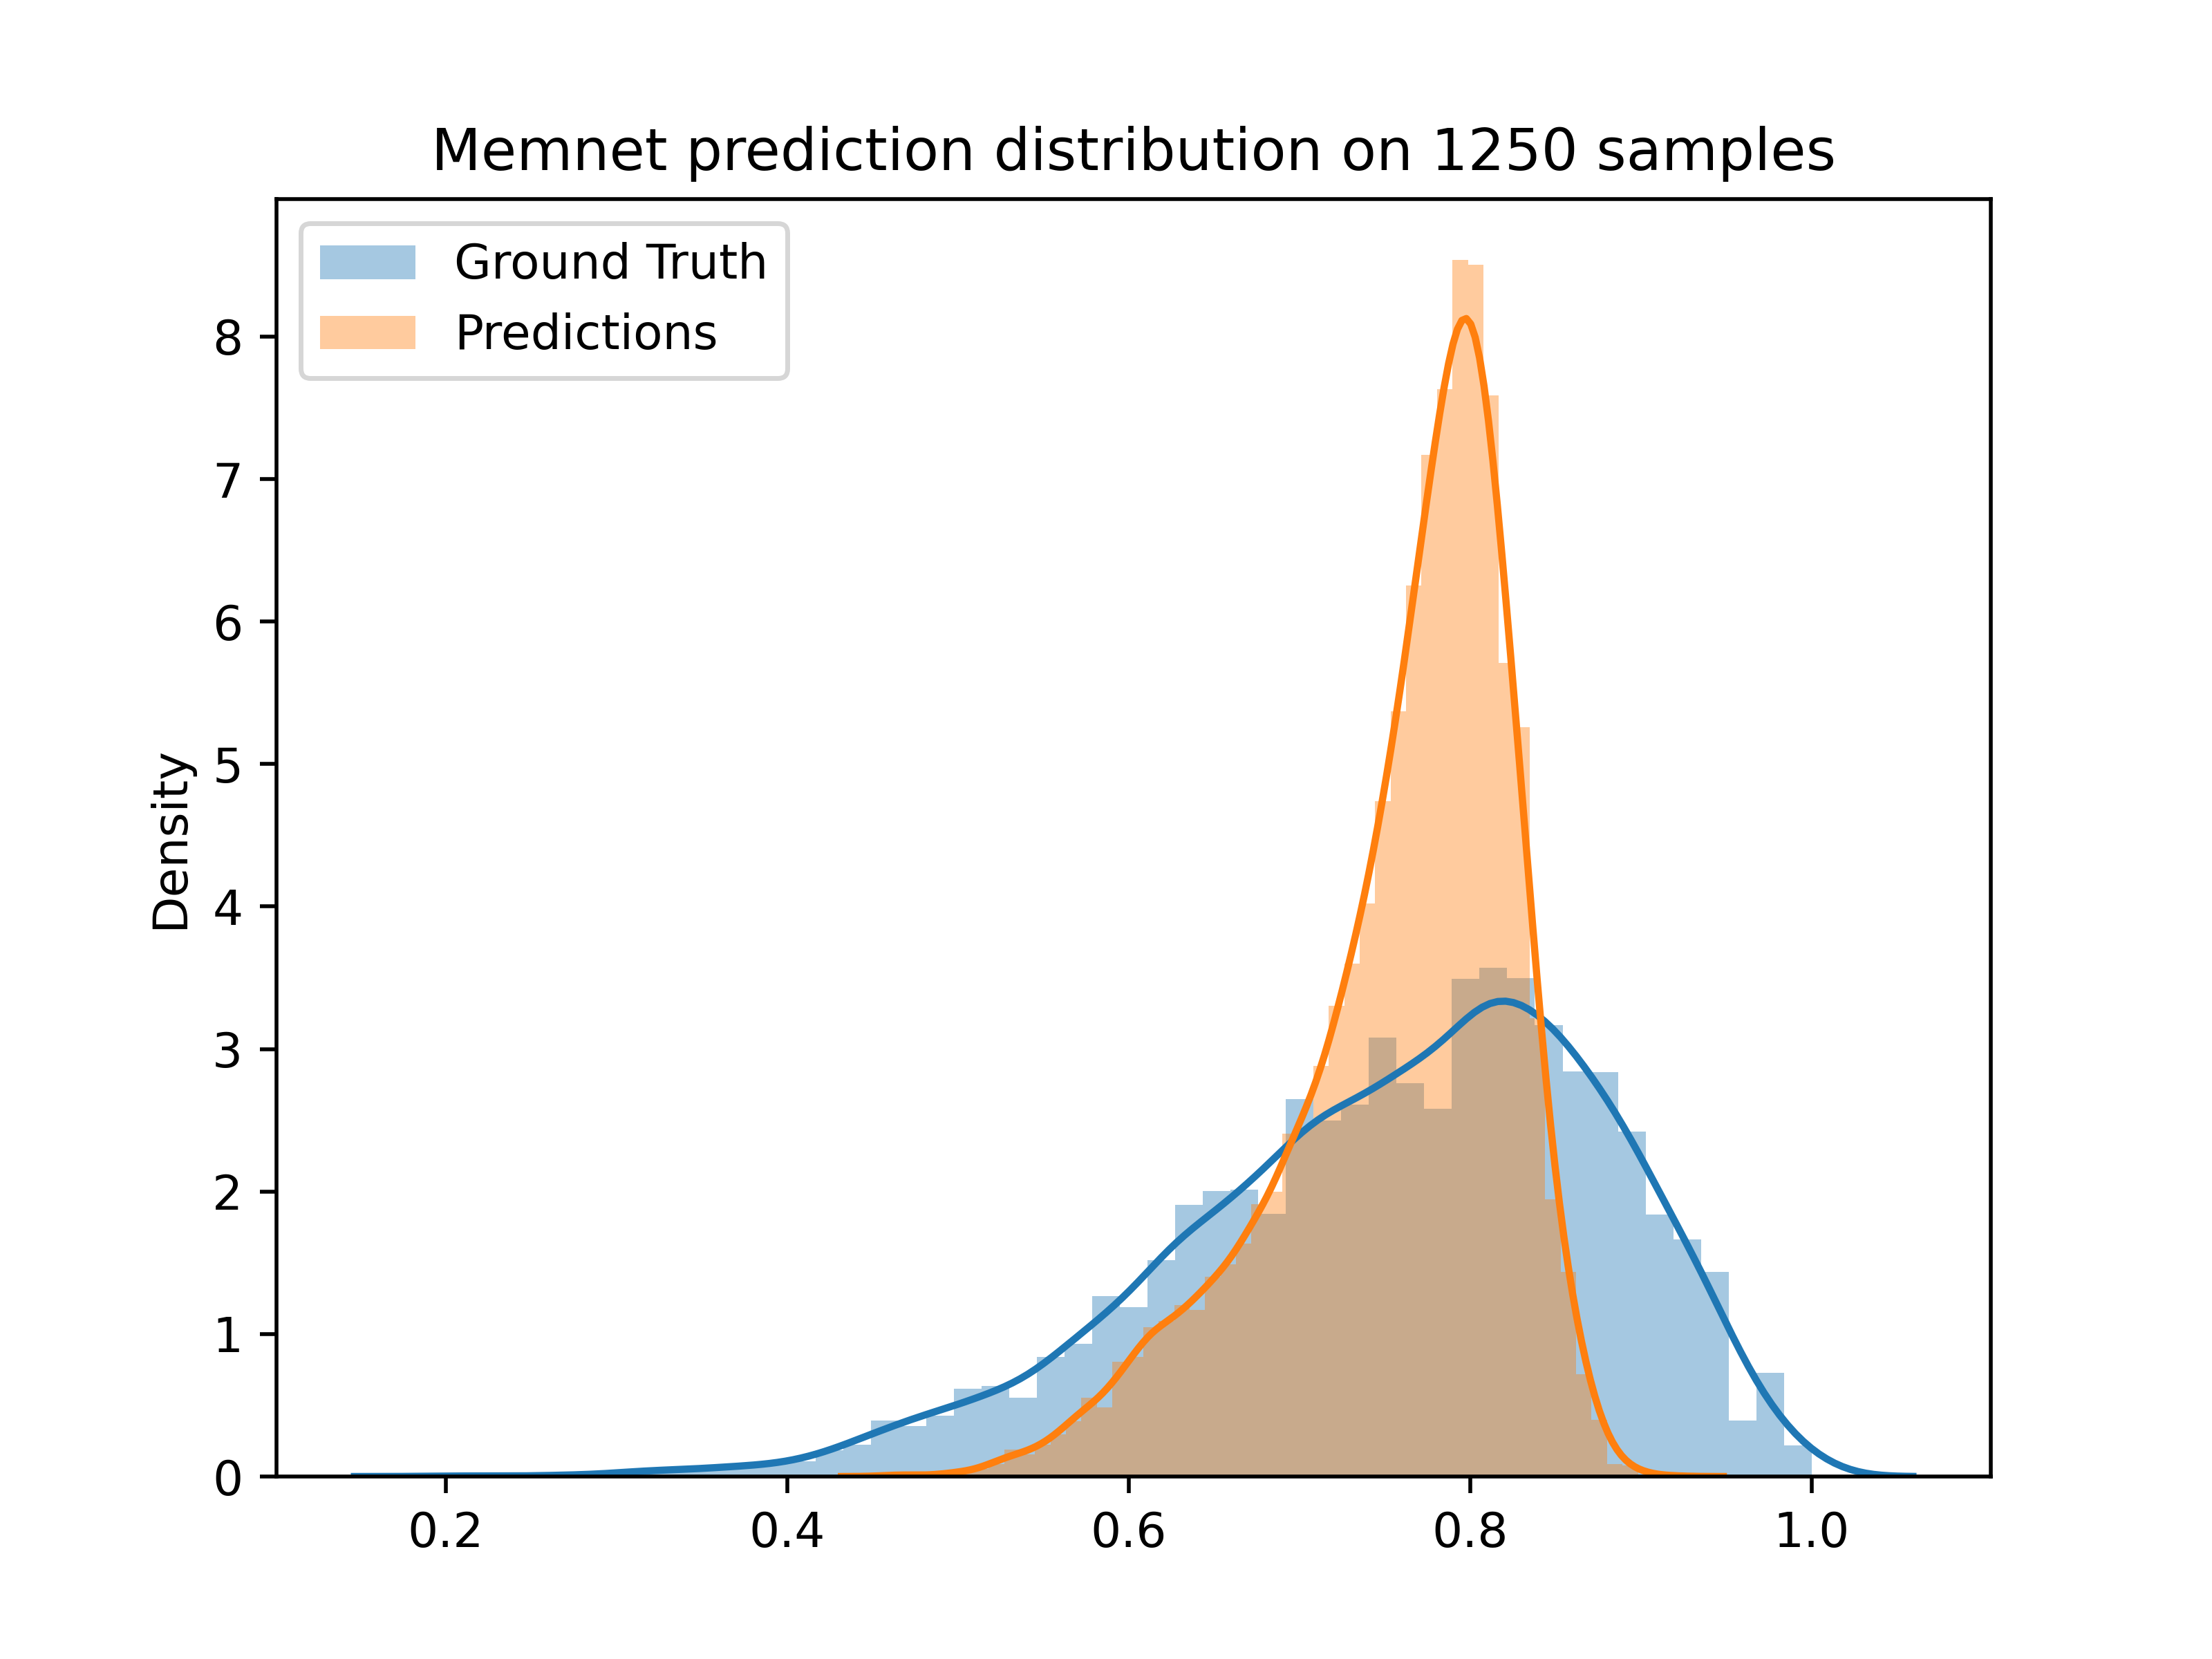
When trained on the combination dataset, with early stopping determined by rank correlation on a validation set, this remade MemNet has a rank correlation 0.55 on a held out test set, and an MSE Loss of 0.012. This implies that, on average, the memorability scores are, accurate to 0.11.
Performance of ResMem
Preliminary investigations found here indicate that the version of MemNet found online may have had some technical issues. In short, the model is probably overfit. The distribution of predictions when run on LaMem is much tighter than the distribution of LaMem’s ground truths. This indicates some degree of regression towards the mean.
By reconstructing MemNet in PyTorch by reverse engineering the model found online, we can learn more about the training process. By training this new model on both MemCat and LaMem, we can consider hypothetical alternate versions of the model.
An older analysis of this can be found here.
One of the interesting things about using residual neural networks in this task is that we can create two separate models. One which uses a classic categorization method as an intermediate feature, and another which is allowed to retrain the residual features to optimize specifically for memorability.
ResMem’s prediction distribution is shown below.
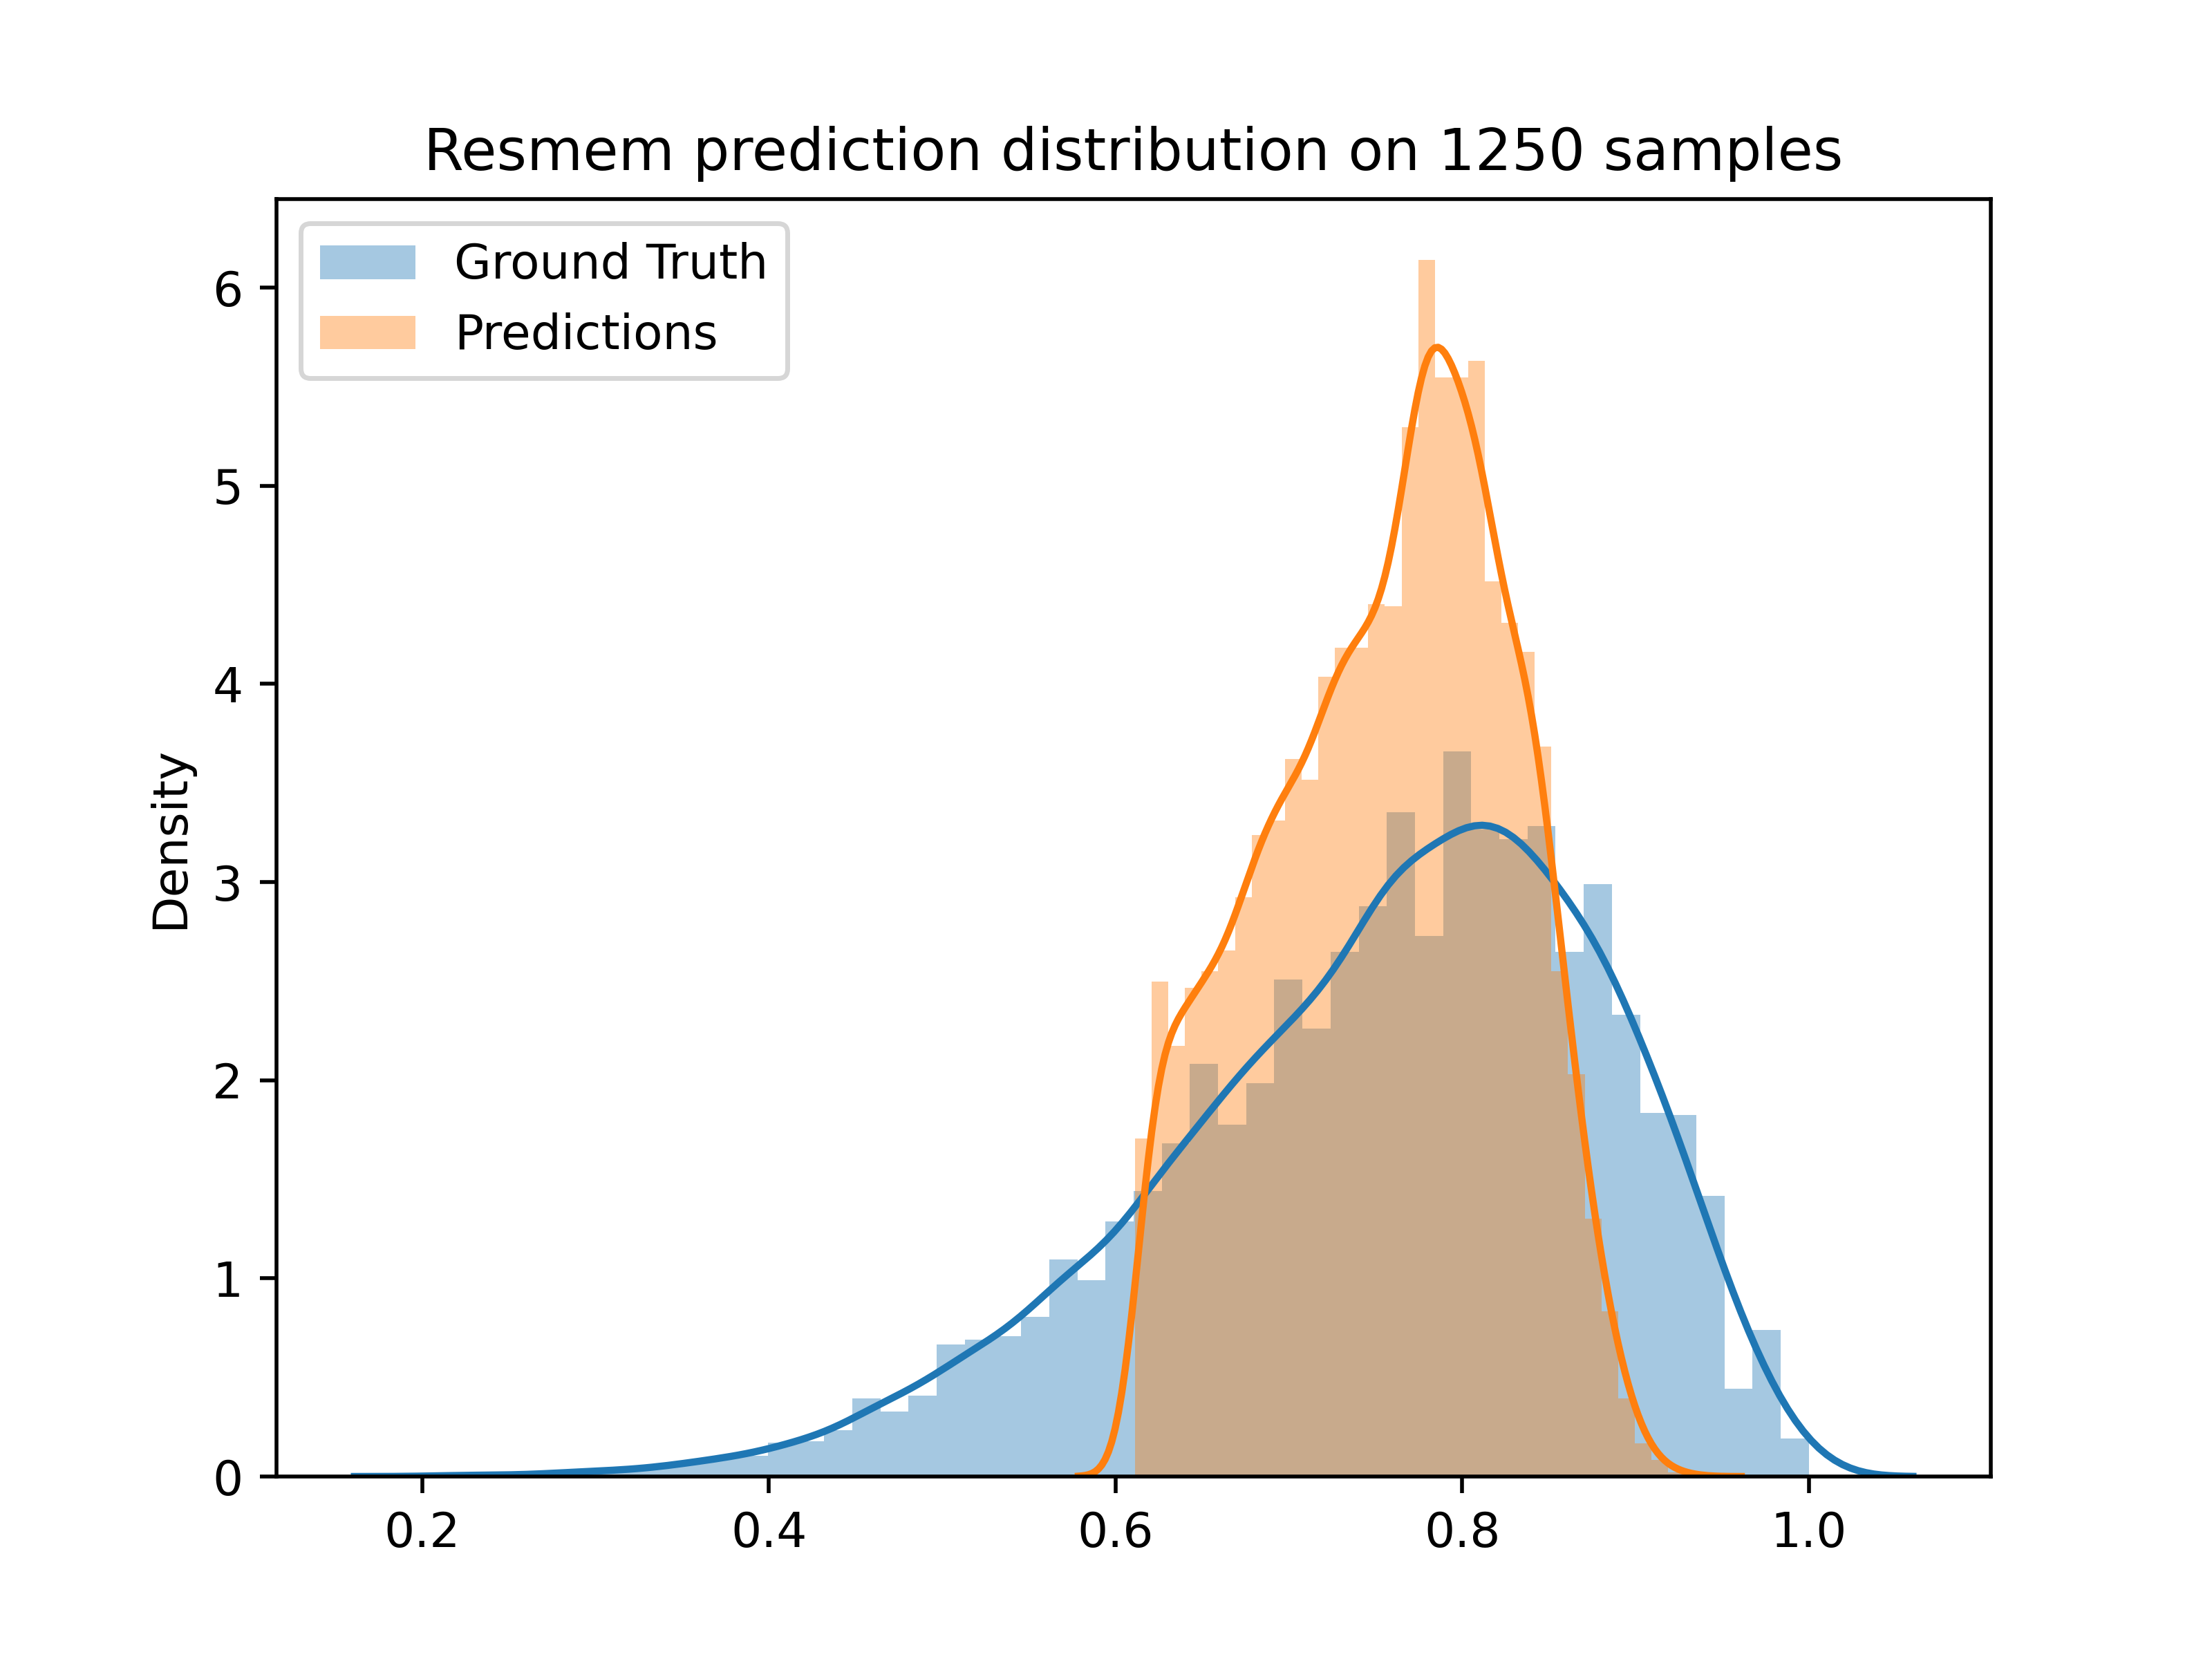
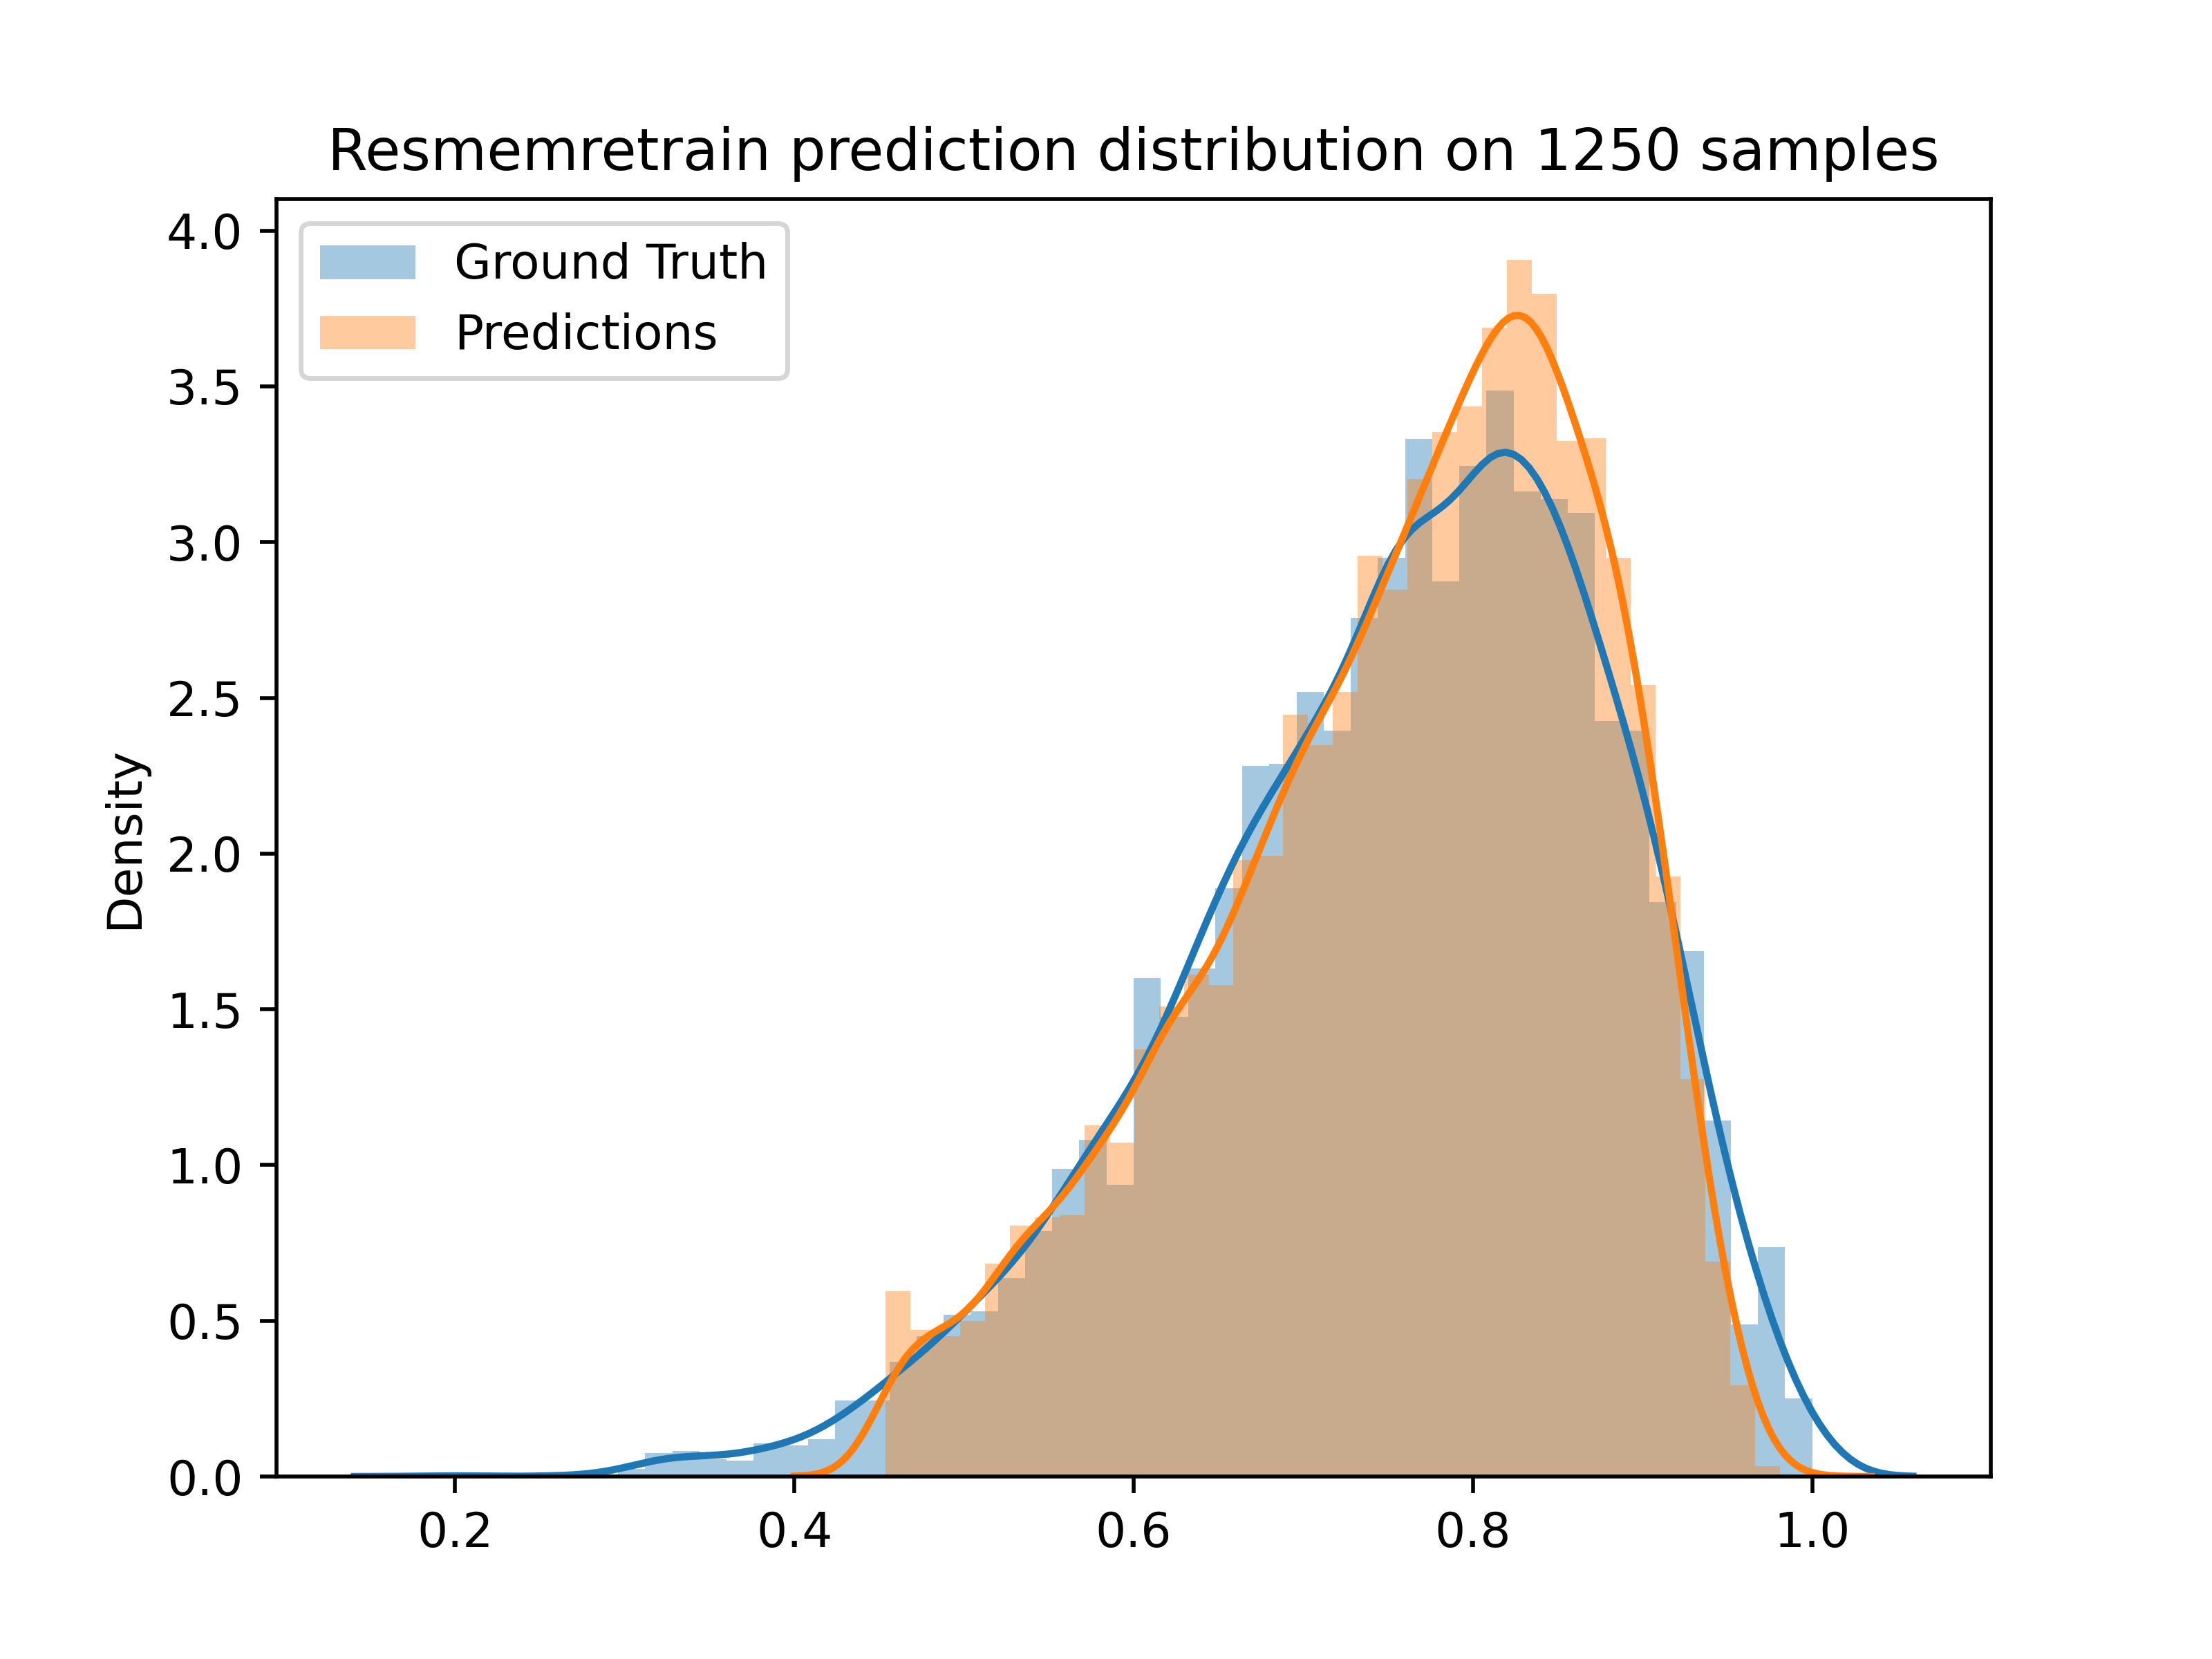
Compared to the others, this is astounding. We do see some cutting off at the low and high ends, but overall this is much closer to the ground truth distribution. Furthermore, this model achieves a rank correlation of 0.68, similar to its counterpart, but achieves tests losses as low as 0.008. It is, on average, accurate to within 0.08 for all images. But let’s dig into that a tad more. The distribution plot shows that some images are completely cut off of the prediction set. Why are these models so poorly performing in the end points? Well on the low end, it’s simply because not many images have that low of a memorability score. The lowest score in the dataset is 0.2, and the lowest score that ResMemRetrain will assign is 0.411.
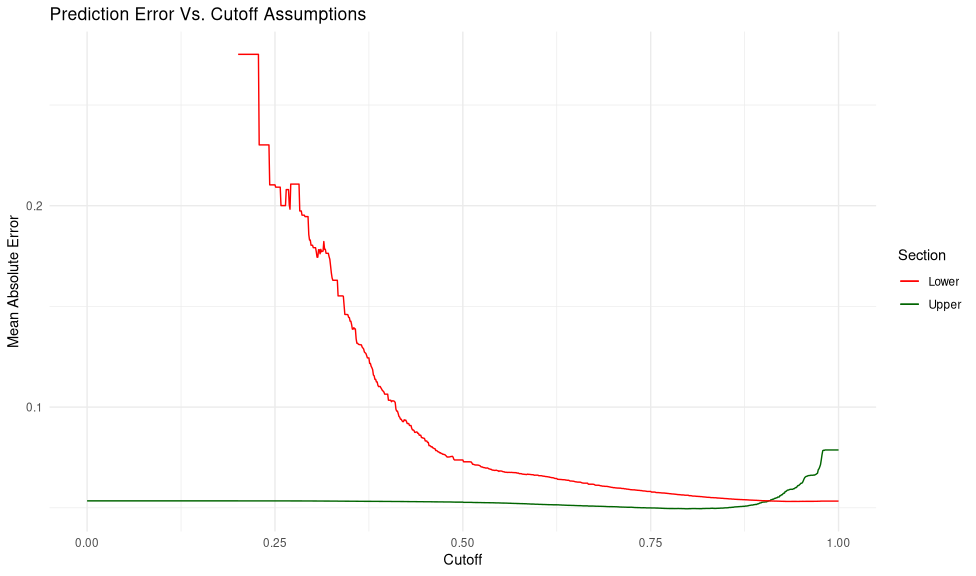
These weird edge cases are probably making the average error higher than it would be in most cases. Placing this cutoff at 0.411, we remove 0.6% of cases, and the loss improves to 0.0028, with mean absolute error of 0.053. If you place this cutoff arbitrarily, you get the chart below.
In future posts we will see if we can improve the prediction distributions, and do higher-order analyses on the models themselves, to see if we can uncover the more complex statistical properties of our datasets.
References
Isola, P., Xiao, J., Parikh, D., Torralba, A., & Oliva, A. (2014). What Makes a Photograph Memorable? IEEE Transactions on Pattern Analysis and Machine Intelligence, 36(7), 1469–1482. https://doi.org/10.1109/TPAMI.2013.200
Pieters, M., & Wiering, M. (2018). Comparing Generative Adversarial Network Techniques for Image Creation and Modification. ArXiv:1803.09093 [Cs, Stat]. http://arxiv.org/abs/1803.09093
Wang, A., Singh, A., Michael, J., Hill, F., Levy, O., & Bowman, S. (2018). GLUE: A Multi-Task Benchmark and Analysis Platform for Natural Language Understanding. Proceedings of the 2018 EMNLP Workshop BlackboxNLP: Analyzing and Interpreting Neural Networks for NLP, 353–355. https://doi.org/10.18653/v1/W18-5446
Khosla, A., Raju, A. S., Torralba, A., & Oliva, A. (2015). Understanding and Predicting Image Memorability at a Large Scale. 2015 IEEE International Conference on Computer Vision (ICCV), 2390–2398. https://doi.org/10.1109/ICCV.2015.275